Beneath Bitcoin's Quiet Rally

Late one summer evening in 2025, Bitcoin breached $120,000 for the first time. The milestone should have felt triumphant—another all-time high in a year already marked by steep climbs. And yet, as the news ricocheted through crypto circles, a curious quiet hung in the air. On social media, celebrations were surprisingly muted. More tellingly, on the blockchain itself there was an absence of the usual frenzy. In past cycles, each new peak unleashed a wave of profit-taking, as long-time holders rushed to realize gains. This time was different: the expected surge of investors cashing out simply didn’t materialize. If you only watched the price, you saw Bitcoin’s ascent. But if you listened to the blockchain’s heartbeat, you heard a softer rhythm, one that hinted the rally might not be as robust as it appeared on the surface.
For those versed in on-chain analytics, this silence spoke volumes. It was captured by an obscure but insightful indicator called the BTC Volatility-Adjusted Net Realized Profit/Loss. The name is a mouthful, but the idea is straightforward: it measures how much profit (or loss) investors are realizing on-chain, adjusted for Bitcoin’s growing scale and typical volatility. In essence, it’s a way to gauge the true significance of profit-taking by comparing it to what’s normal for Bitcoin at this stage. Bitcoin today isn’t the same beast it was a decade ago – its market cap is magnitudes larger and its price swings, while still dramatic, have mellowed over time. The volatility-adjusted profit/loss metric accounts for that. It records profit and loss in BTC terms (not dollars) to normalize against Bitcoin’s growth, and then scales it by a 7-day volatility factor. Think of it like measuring waves relative to the tide: a five-foot wave during a calm sea is huge, but the same during a storm barely stands out. This tool ensures we notice the truly big waves of profit-taking or loss-taking relative to the market’s usual turbulence.
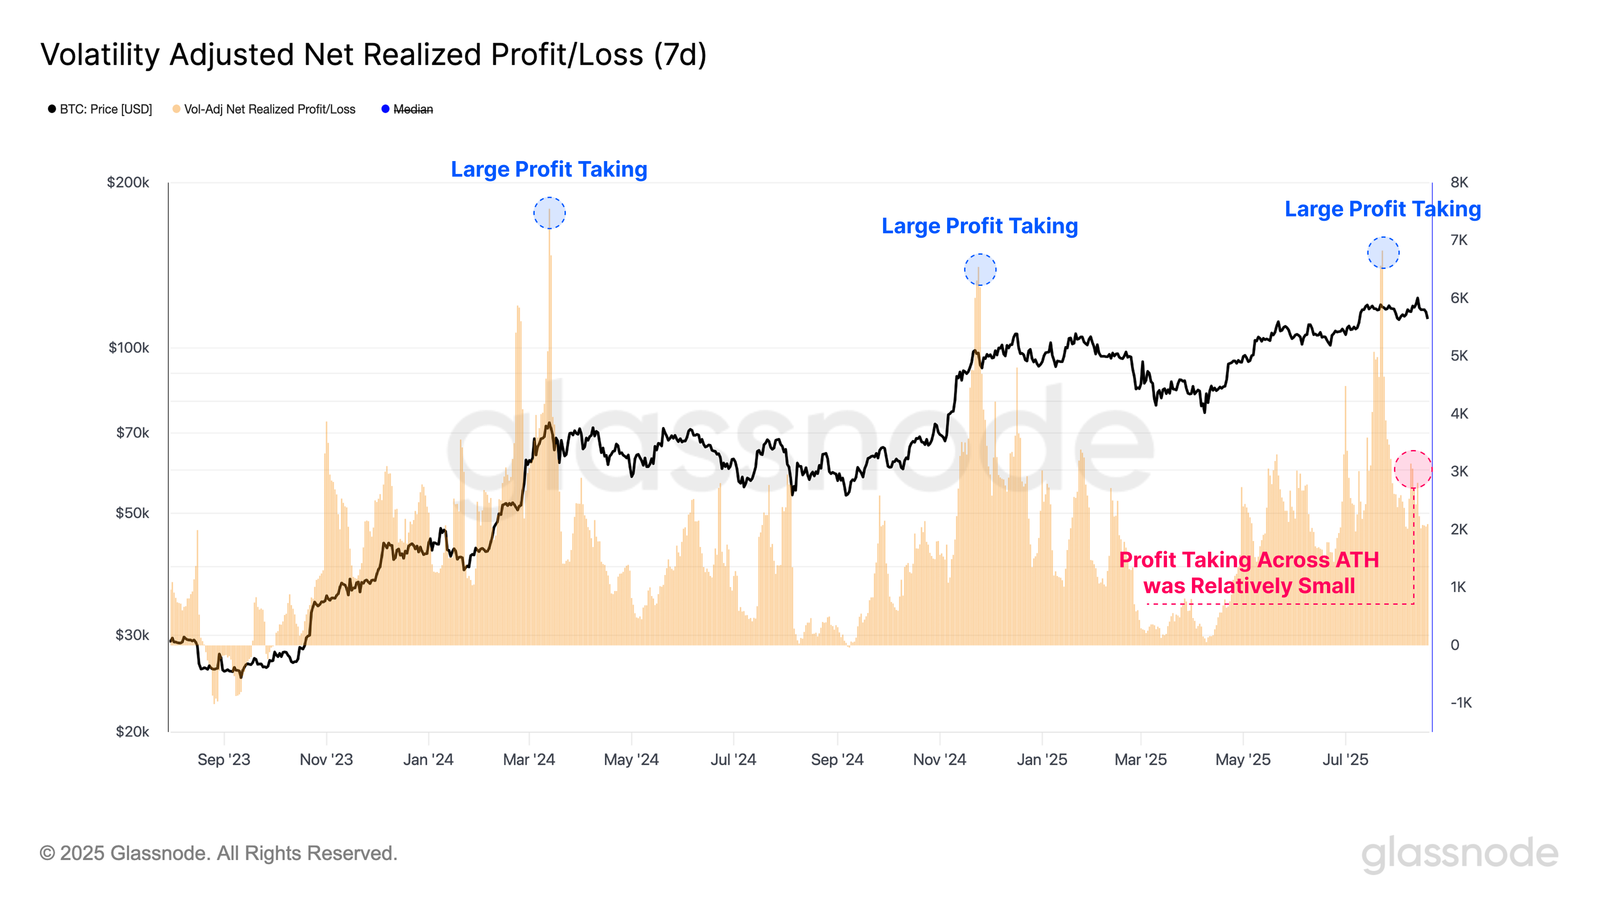
Historically, whenever Bitcoin blasted through a major price barrier, this metric lit up with spikes of realized profits. Last cycle’s run to $70k and then $100k in 2024, for example, saw towering peaks on the volatility-adjusted chart. Those were the fingerprints of countless investors seizing the moment to cash out. Importantly, each profit-taking spike coincided with ample buy-side demand ready to absorb those coins. In other words, a surge of people selling into profit was met by a surge of others eager to buy – a sign of a heated but balanced euphoria. These moments felt like classic climax points of a bull market: holders jubilantly taking money off the table, while fresh capital eagerly jumped in, keeping the rally alive.
But in July 2025, as Bitcoin inched to a new high around $124k, that familiar pattern broke. The volatility-adjusted profit/loss line barely blipped upward. Instead of a crescendo of profit-taking, there was a whisper. Many long-term holders, it seemed, chose not to sell at this peak. One interpretation – the one Glassnode’s analysts put forward – is that the rally faltered not because of overwhelming sell pressure, but due to a lack of new buyers stepping in. The usual feeding frenzy of demand wasn’t there to propel prices higher. With relatively few coins being sold, one might expect the price to hold steady or climb, but the opposite happened: Bitcoin slipped back from its high. The market had effectively run out of breath; it wasn’t a flood of sellers that ended the party, but rather a shortage of fresh enthusiasm to keep it going. In the metaphor of our waves, the tide went out even though no massive wave crashed – the sea simply receded, quietly and almost perplexingly.
This unusual state of affairs is precisely why the volatility-adjusted profit/loss metric matters right now. It flagged a subtle shift in market behavior that price alone didn’t reveal. In fact, Glassnode noted that around this time the metric reverted to its long-term median level, a seemingly innocuous middle ground that has historically marked a boundary between bull and bear regimes. In plainer terms, the market’s fever broke; the indicator falling back to median was like a thermometer returning to normal after a high fever, often observed at the turning point between an overheating rally and a cooling phase. This doesn’t guarantee the bull run is over, but it does suggest the exuberance of the past year has drained away, leaving us at a crossroads. It’s a moment where the market must decide its next direction – a delicate balance where either new optimism ignites, or a deeper chill sets in.
...
Having explored the volatility-adjusted profit/loss metric’s potential impact on investor sentiment and market structure, you may be wondering how to apply these insights to your own challenges. Our team of experts is ready to help you discover how behavioral analytics and precision data could transform your approach. Connect with us.